USDCAD and USDCNH: USDCAD is trying to start a recovery
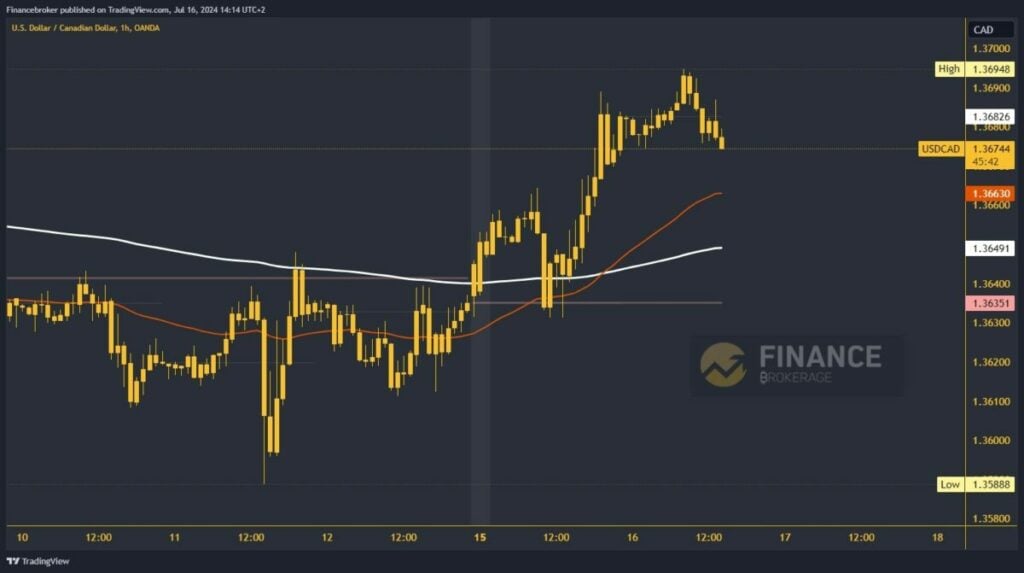
- During this morning’s Asian trading session, USDCAD jumped to a new weekly high at 1.36948.
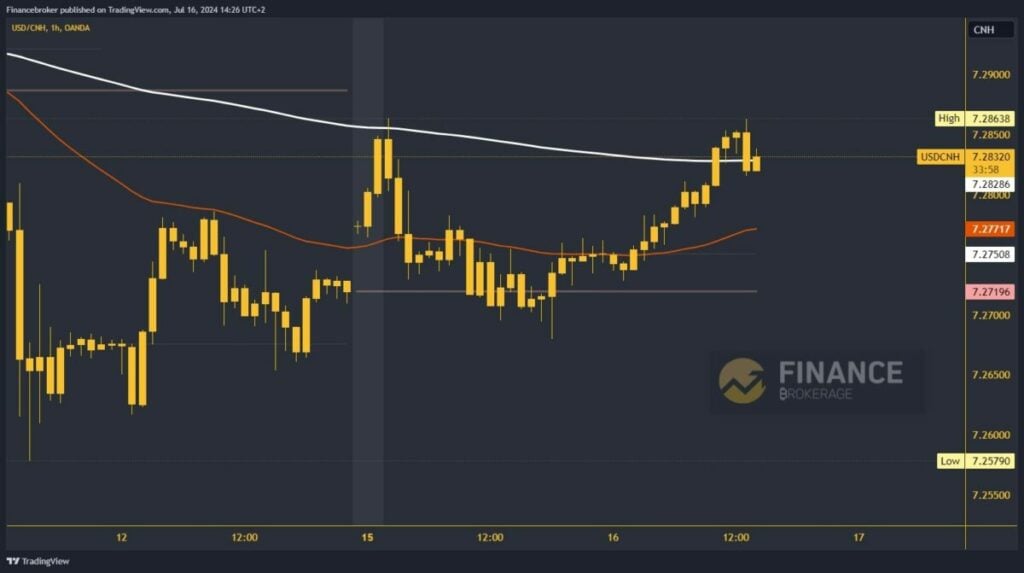
- In the previous hour, USDCNH rose to 7.28638 level.Â
USDCAD chart analysis
During this morning’s Asian trading session, USDCAD jumped to a new weekly high at 1.36948. After that, the bullish momentum declined, and the pair retreated to the 1.36750 level. We are still under pressure to slide a little lower to find a better support level. Potential lower targets are the 1.36600 and 1.36500 levels. Additional support is the EMA 50 moving average at 1.36600, while the EMA 200 is at 1.36500.
For a bullish option, USDCAD would have to stabilize again above the 1.36800 level. If he succeeds in that, he will have a new opportunity to start a recovery and test this morning’s high. A new test could produce an impulse above and form a new weekly high. Potential higher targets are 1.37000 and 1.37100 levels.

Â
USDCNH chart analysis
In the previous hour, USDCNH rose to 7.28638 level. There, we tested this week’s high, which was formed on Monday in the Asian session. Additionally, pressure on that zone creates the EMA 200 moving average. This is a new chance to see a break above the EMA 200 and make a more concrete bullish recovery. Potential higher targets are 7.29000 and 7.29500 levels.
On the other hand, a bearish scenario for USDCNH is also a possibility. A new bearish consolidation initiation and a drop below the 7.28000 level could confirm the bearish pressure on the pair. In this case, USDCNH will have to look for new support at lower levels, with potential lower targets at 7.27000 and 7.26000 levels. Additional support at 7.27000 is at the EMA 50 moving average, signaling a need for caution.

Â
The post USDCAD and USDCNH: USDCAD is trying to start a recovery appeared first on FinanceBrokerage.

