Oil and Natural Gas: Natural gas is back above $3.00
- The price of oil rose to the $76.25 level on Friday.
- The price of natural gas created a bullish gap at the market’s opening this morning.
Oil chart analysis
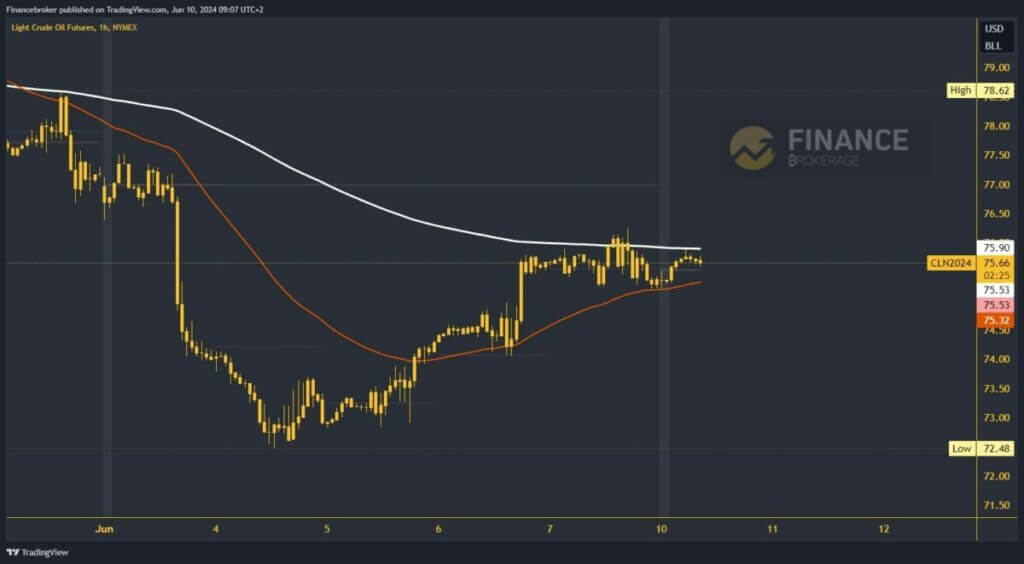
The price of oil rose to the $76.25 level on Friday. In this zone, we come across the EMA200 moving average and for now, we are not going above it. During this morning’s Asian trading session, the movement of oil took place in the $75.25-$75.90 range. We still have resistance at the EMA200 and need a bullish impulse to move us above. Such a move would wake up the price to start a bullish recovery.
Potential higher targets are $76.50 and $77.00 levels. We need a negative consolidation and pullback to the $75.00 level for a bearish option. Thus, we move below the weekly open price and increase the pressure on the price to continue falling. The negative picture is reinforced by the fact that the EMA50 moving average is moving to the bearish side. Potential lower targets are $74.50 and $74.00 levels.

Â
Natural gas chart analysis
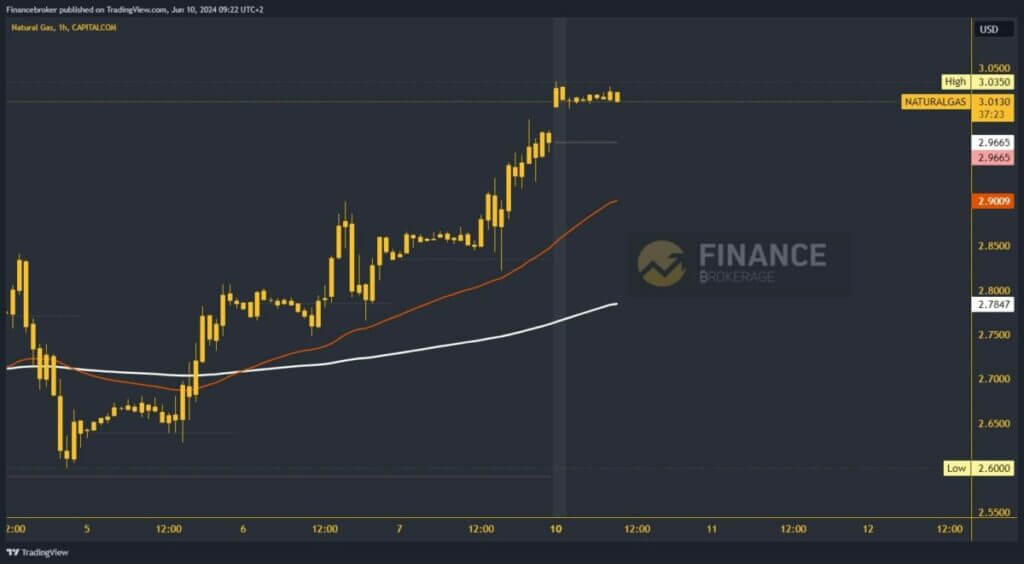
The price of natural gas created a bullish gap at the market’s opening this morning. We saw a jump from $2.96 to $3.03 level. The price is quite stable in the sequel, hovering around the $3.00 level. There is a slight pressure on the price, which could trigger a pullback and close this morning’s gap. That brings us back to testing the weekly open price. Potential lower targets are $2.90 and $2.85 levels.
Additional support in the $2.90 zone is at the EMA50 moving average, while the EMA200 is down at $2.80. We need positive consolidation and momentum above the $3.05 level for a bullish option. This moves us to a new June high, and we will have an opportunity to continue higher. Potential higher targets are $3.10 and $3.15 levels.

Â
The post Oil and Natural Gas: Natural gas is back above $3.00 appeared first on FinanceBrokerage.

