Oil and natural gas: Oil remains bullish above $81.50
- On Friday, the oil price rose to the $82.72 level.
- The price of natural gas is in a bearish trend for the fourth week in a row.Â
Oil chart analysis
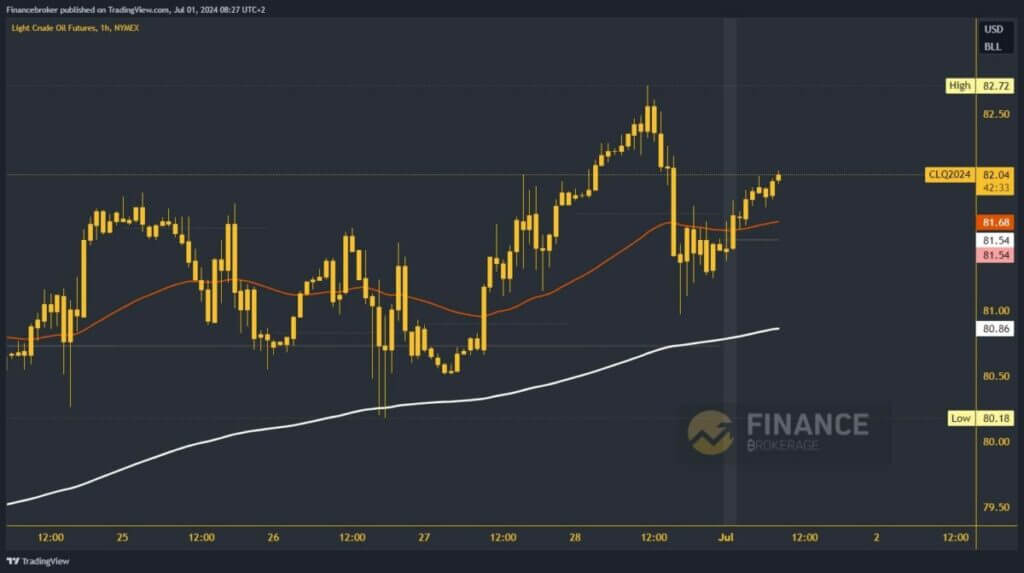
On Friday, the oil price rose to the $82.72 level. The inability to hold up there led to the initiation of a bearish consolidation and a drop to support at the $81.00 level. During this morning’s Asian trading session, we see a bullish trend in oil prices and a rise to $82.00. Now, we need to hold on here in order to start further growth on the bullish side.
Potential higher targets are $82.50 and $83.00 levels.
We need a negative consolidation and pullback to the $81.50 support level for a bearish option. There, we will test the weekly open price. The price drop below sends oil to the negative side, directing it to lower levels. Potential lower targets are $81.00 and $80.50 levels. Additional support for the price could be found in the EMA200 moving average around the $81.00 level.

Â
Natural gas chart analysis
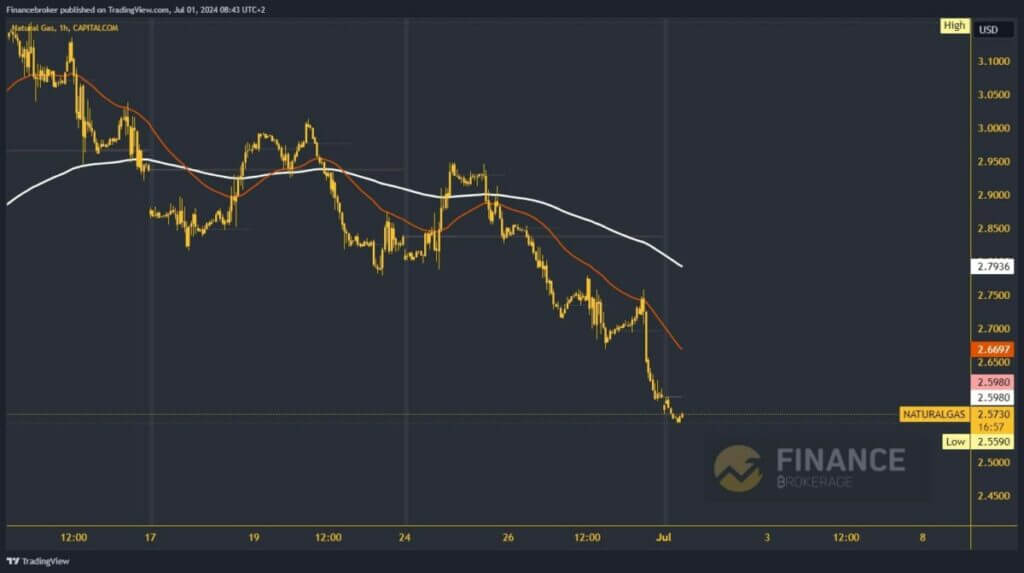
The price of natural gas is in a bearish trend for the fourth week in a row. After we saw the formation of a new monthly high on June 11 at the $3.19 level, the price began a pullback that continues today. During this morning’s Asian trading session, a new low was formed at the $2.55 level. For now, we are holding above that level and moving up to $2.57. A return above $2.60 would bring the price back above the weekly open price and increase the chances that we could see a bullish consolidation.
Potential higher targets are $2.65 and $2.70 levels. Natural gas could find additional support at the EMA50 moving average if it moves above $2.65. We need a negative consolidation and a drop below this morning’s support for a bearish option at $2.55. Thus, we move to a new weekly low and confirm the bearish momentum. Potential lower targets are the $2.50 in $2.45 levels.

Â
The post Oil and natural gas: Oil remains bullish above $81.50 appeared first on FinanceBrokerage.

