Oil and Natural Gas: the price of oil stops at $76.00
- The price of oil has been in a stable bullish trend since Tuesday.Â
- The price of natural gas rose to a new weekly high on Thursday at the $2.69 level.Â
Oil chart analysis
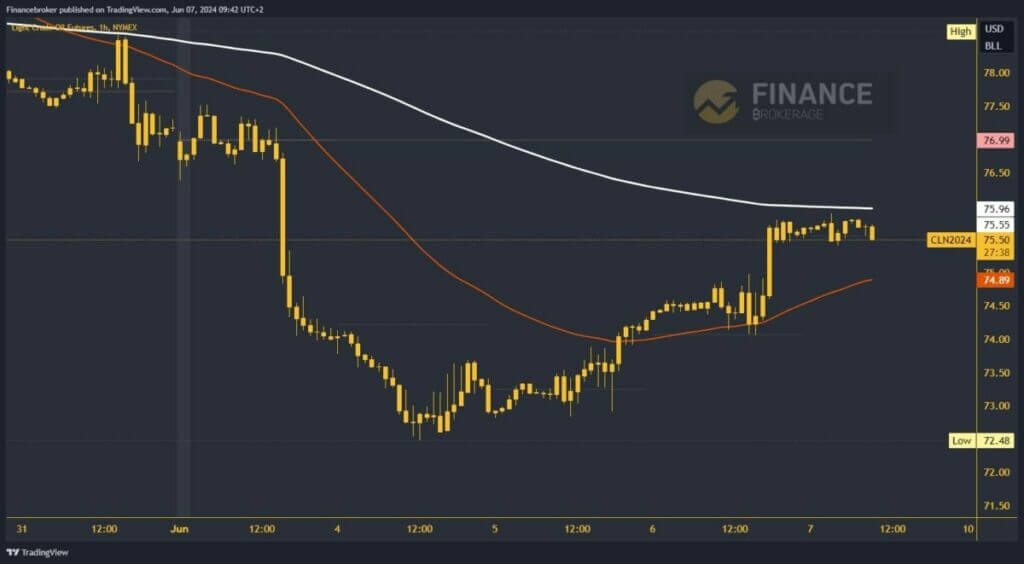
The price of oil has been in a stable bullish trend since Tuesday. On Thursday, the price gets new support at $74.00 and forms a new higher low there. That was confirmation of our continuation on the bullish side. After that, we see a bullish impulse and price growth up to $75.80. During this morning’s Asian session, the movement took place in the $75.40-$75.80 range. On the upside, we have resistance in the EMA200 moving average that does not allow us to move above.
Potential higher targets are $76.00 and $76.50 levels. We need a negative consolidation and pullback to the $75.00 level for a bearish option. The price will try to get the EMA50 moving average support in that zone. If we continue with the momentum below, it will only confirm the move to the bearish side. Potential lower targets are $74.50 and $74.00 levels.

Â
Natural gas chart analysis
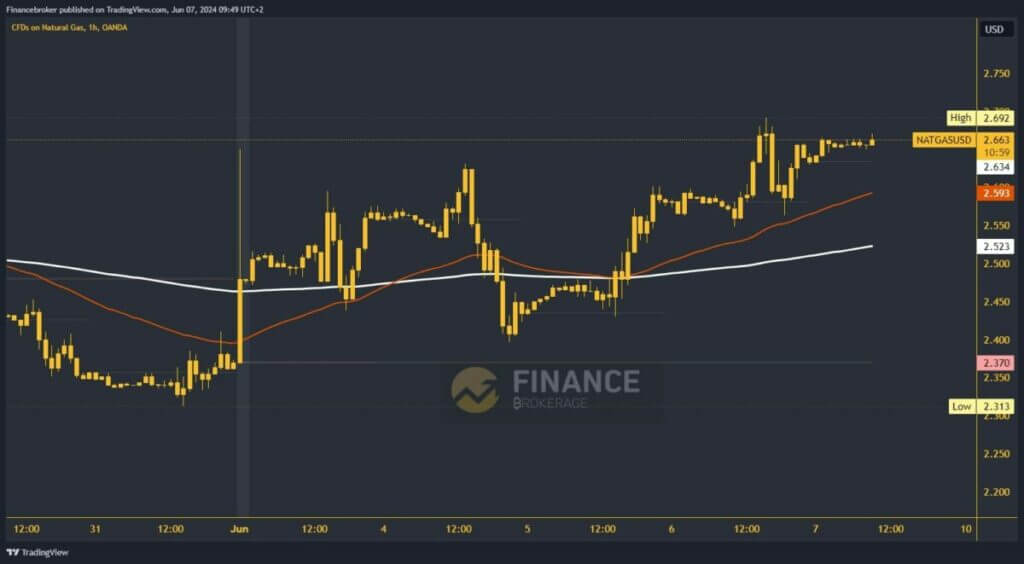
The price of natural gas rose to a new weekly high on Thursday at the $2.69 level. After that, we saw a pullback to support at the $2.55 level. From there, the price initiates a new positive consolidation, rising above the $2.64 level. During this morning’s Asian session, natural gas moved in the $2.63-$2.66 range. We now see price pressure on the upper line and expect a break above.
Potential higher targets are $2.70 and $2.75 levels. We need a negative consolidation and pullback to $2.60 for a bearish option. So we descend to a new daily low and test the EMA50 moving average there. The price is under more pressure to start a further retreat and look for new support there. Potential lower targets are $2.55 and $2.50 levels

Â
The post Oil and Natural Gas: the price of oil stops at $76.00 appeared first on FinanceBrokerage.

