The dollar index under pressure drops below 105.00 level
- The dollar index fell to the lowest branch this week at the 104.35 level.
Dollar index chart analysis
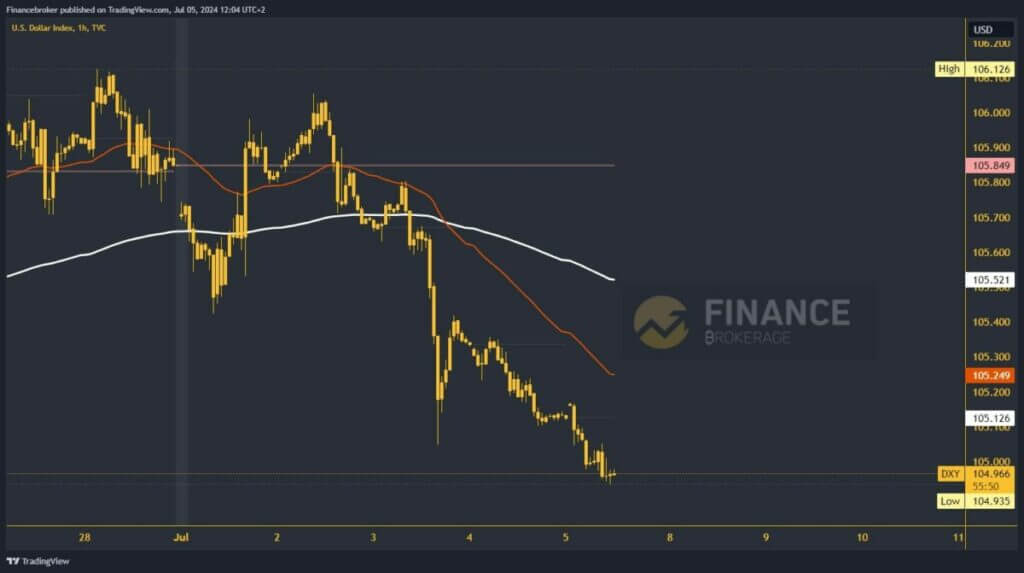
The dollar index fell to the lowest branch this week at the 104.35 level. On Monday, only the index held well above the EMA200 moving average. On Tuesday, after forming a high at 106.05, the value of the dollar index began to retreat. On Wednesday, we saw strong bearish impulses and a drop to 105.05. We got the first support at that level and recovered to 105.40.
On Thursday, the index failed to hold in that zone and continued to retreat to the 105.10 level. During this morning’s Asian session, the trend remained unchanged, and the dollar continued to slide to 104.35. We are currently holding at a three-week low, and there is a significant possibility of a further pullback and the formation of a new low. Potential lower targets are the 104.90 and 104.80 levels.

Â
Will the dollar fall to a new July low or gain support?
There is a potential for a bullish option, which would require a positive consolidation and stabilization above the 105.00 level. If this is achieved, the dollar index could create a bullish impulse and initiate a recovery. This could lead to potential higher targets at the 105.10 and 105.20 levels. Additional resistance is EMA50 and the 105.25 zone, while EMA200 is at the 105.50 level.
Data on average hourly earnings, nonfarm payrolls, and unemployment rate will be published at the beginning of the US session. These data are key indicators of the US economy’s health and can significantly influence the dollar index and its movement. Positive data could strengthen the USD’s position, while negative data could lead to a further decline. Toward the end of the US session, we will have the Fed Monetary Policy Report, which will provide insights into the future direction of the US monetary policy and its potential impact on the dollar index.
Â
The post The dollar index under pressure drops below 105.00 level appeared first on FinanceBrokerage.

